Article Archives
Stocks & October Crop Report
Tuesday, October 26, 2021
filed under: Marketing/Risk Management
By Mike Krueger*
The USDA threw oilseeds markets an unexpected curveball in the September 30th quarterly stocks report. Soybean stocks on hand as of September 1, 2021, were much higher than expected. September 1 corn and wheat stocks were slightly smaller than expected. September 1 soybean stocks were still down 51% from a year ago, with corn stocks down 36% and wheat stocks down 18%.
The USDA pegged September 1 sunflower stocks up 100% from a year ago. This might be the only crop that had increased supplies over 2020.
USDA followed the bearish September 30 soybean numbers with even more bearish soybean yield and production estimates in their October 12, 2021, reports. A larger production number led to a larger soybean ending supply number.
 November Soybean Futures
Soybeans:
November Soybean Futures
Soybeans:
The USDA pegged soybean stocks in the U.S. as of September 1 at 256 million bushels. This was 81 million bushels above what the trade expected. They increased 2020 soybean production by 81 million bushels to account for the much larger number. There are four quarterly stocks reports a year plus monthly production estimates. Evidently all these previous reports weren’t accurate.
The September 1 soybean stocks number became the ending supply or carry-in number for the supply and demand tables. Ending stocks in September were estimated at 185 million bushels. That number changed to 256 million bushels in the October WASDE. This, of course, also added 80 million bushels to the 2021/22 soybean balance sheet. It changes the soybean outlook from bullish to neutral at best and more likely somewhat bearish.
The USDA October production estimate increased the soybean yield by 0.9 bu/ac. This increased production slightly. The combination of larger beginning stocks and larger production took projected 2021/22 soybean ending supplies from 185 million bushels in September to 320 million bushels in October. This increase was expected.
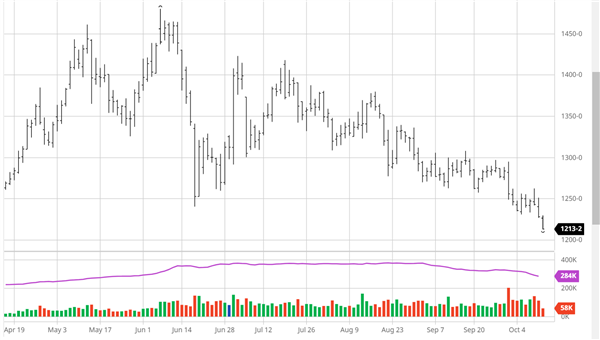
November soybeans dropped from a high on June 7 near $14.80 to a low in mid-October of $12.23.
Sunflower:
All (oils and confection) sunflower was estimated in the October report to be down 35% from last year.
Corn:
The corn stocks number was slightly larger than expected, but not enough big enough to create a bearish outlook. Like soybeans, the September 1 stocks number will now become the ending stocks number for the 2020/21 marketing year that ended August 31.
The previous estimate was 1.408 billion bushels. That dropped to 1.24 billion bushels in the October report.
The USDA increased the corn yield estimate by 0.2 bushel per acre. That is splitting hairs. The smaller beginning stocks, coupled with the small production increase, resulted in corn ending supplies for the current marketing year dropping 92 million bushels (to 1.408 billion bushels) from the September estimate.
There has been discussion about the slow pace of corn export sales. The pace is, in fact, the second biggest on record.
China has purchased nearly 12 million metric tons of corn, with another four or five MMTs listed in the “unknown” category.
A bigger factor is that Brazil’s corn crop was a disaster. ?They are the world’s third largest corn exporter and are now basically out of the game until next summer.
Corn futures rallied from $4.97 on September 10 to $5.48 on September 30.
Wheat:
The world wheat situation continues to tighten even with forecasts of record world production. Ending stocks among the world’s major wheat exporting countries are the smallest since 2007/08.
Canada’s wheat crop is down almost 50% because of the drought. The U.S. hard red spring wheat crop is down more than 50% from last year. The white wheat crop (Pacific Northwest) was also badly hurt by drought.
Russia’s wheat crop was smaller than they previously admitted. The EU had a big crop, but less than 30% is milling quality. Australia has a boomer crop on the way, but they have some major logistical issues — plus they can’t fill all the business.
Wheat stocks as of September 1 were down 18% from last year.
The October USDA report reduced U.S. wheat ending supplies to 580 million bushels. This is the smallest ending supply number for U.S. wheat in decades. It is bullish.
Minneapolis December wheat went from a low on April 1 near $6.25 to new highs in mid-October above $9.50.
Where can we expect markets to go from here?
• Wheat will now lead corn and soybean prices.
• Final corn and soybean yields will determine price direction for these crops until/unless exports become more active.
• It is dry across much of the Southern Plains as the hard red winter wheat crop is being planted.
• It is hot and dry across central and southern Brazil and parts of Argentina as soybean and corn plantings are starting.
• Most weather folks are talking about a weak La Niña. That can mean dryness in Argentina and southern Brazil and a drier-than-normal summer in Australia.
• The pace of U.S. export sales will also be very important. As noted earlier, Brazil’s 2021 corn crop was a disaster. That should push more corn exports to the U.S. Tight wheat supplies among the major wheat exporting countries should help U.S. wheat exports.
* Mike Krueger founded The Money Farm, and is now a senior analyst with World Perspectives, a Washington, D.C.-based consulting company. While the information in this article is believed to be reliable, marketing involves risk, and the author and The Sunflower assume no responsibility for its use.